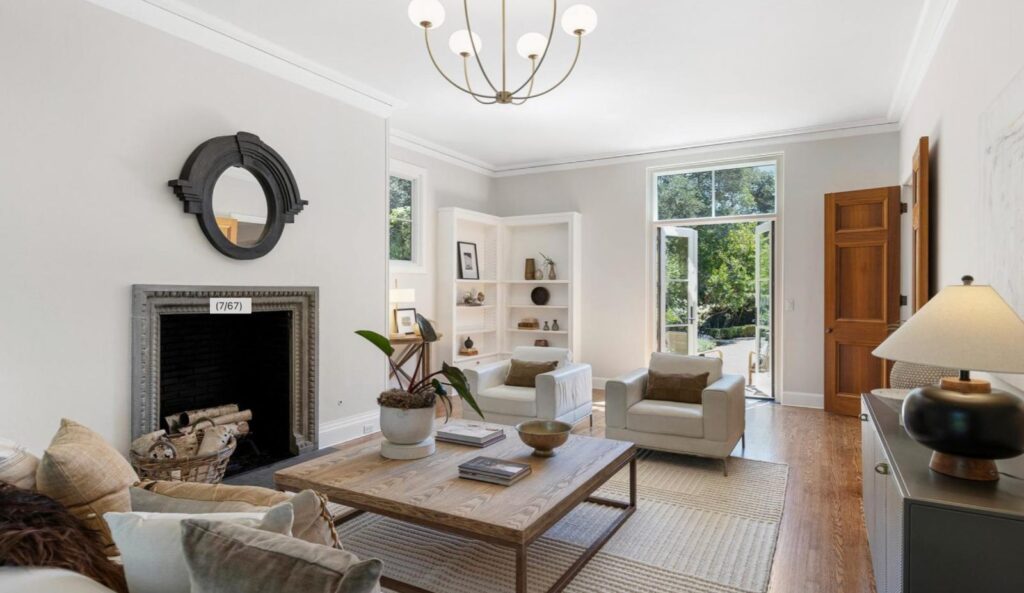
Rockridge led Oakland in September. The typical home there sold 52% over asking, up from 40% in August and 21% last September, and all 9 sales closed above list. Montclair held close to August at 28% over asking, with all 14 sales over list. Around Lake Merritt, Grand Lake and Adams Point, the typical premium was 2%, and about half of the 15 sales went over list.
Berkeley had 62 closed sales, up from 47 in August and 43 a year ago, with a typical premium of 35%. North Berkeley came in at 41% over asking across 17 sales. In Piedmont, all 13 sales closed over list at a median price of $2.8M. Across Oakland, median days on market dropped to 14, from 17 in August and 21 last September.
Oakland by Neighborhood
| Area | Closed sales | Median price | Median days on market | Median over asking | Share sold over asking |
|---|---|---|---|---|---|
| Rockridge | 9 | $1.91M | 14 | 52% | 100% |
| Montclair | 14 | $1.41M | 17.5 | 28% | 100% |
| Temescal & North Oakland | 11 | $1.20M | 14 | 24% | 91% |
| Crocker Highlands & Trestle Glen | 8 | $1.83M | 13 | 31% | 88% |
| Glenview, Dimond & Oakmore | 19 | $750K | 12 | 20% | 95% |
| Lake Merritt, Grand Lake & Adams Point | 15 | $545K | 14 | 2.2% | 53% |
| Oakland total | 208 | $804K | 14 | 10% | 72% |
Oakland total includes all Oakland sales, not only the neighborhoods shown.
Berkeley by Neighborhood
| Area | Closed sales | Median price | Median days on market | Median over asking | Share sold over asking |
|---|---|---|---|---|---|
| North Berkeley | 17 | $1.83M | 14 | 41% | 94% |
| Berkeley Hills | 11 | $1.80M | 14 | 37% | 100% |
| Elmwood & Claremont | 8 | $1.94M | 14.5 | 2.5% | 62% |
| Central & South Berkeley | 11 | $1.50M | 14 | 41% | 100% |
| West Berkeley | 6 | $1.27M | 15.5 | 30% | 100% |
| Berkeley total | 62 | $1.65M | 14 | 35% | 89% |
Piedmont
| Area | Closed sales | Median price | Median days on market | Median over asking | Share sold over asking |
|---|---|---|---|---|---|
| Piedmont | 13 | $2.80M | 12 | 32% | 100% |
How September Compares
Oakland
| Sep 2025 | Aug 2026 | Sep 2026 | |
|---|---|---|---|
| Closed sales | 205 | 197 | 208 |
| Median price | $818K | $770K | $804K |
| Median days on market | 21 | 17 | 14 |
| Median over asking | 3.3% | 6.4% | 10% |
| Share sold over asking | 67% | 73% | 72% |
Berkeley
| Sep 2025 | Aug 2026 | Sep 2026 | |
|---|---|---|---|
| Closed sales | 43 | 47 | 62 |
| Median price | $1.60M | $1.40M | $1.65M |
| Median days on market | 14 | 14 | 14 |
| Median over asking | 28% | 20% | 35% |
| Share sold over asking | 84% | 74% | 89% |
What Buyers Need to Know
- In Rockridge, Montclair, Berkeley Hills and Piedmont, every September sale closed over list. List price in these areas works more like an opening number, and recent sold prices on similar homes give a clearer sense of where offers land.
- Many Oakland and Berkeley listings are priced below expected value to draw multiple offers. Rockridge’s 52% premium partly reflects that pricing convention, so it says as much about how homes are listed as about how hard buyers are competing.
- Around Lake Merritt, Grand Lake and Adams Point, about half of September’s sales closed at or below list, at a median price of $545K. Buyers looking for room to negotiate may find more of it here than in the hill neighborhoods.
- Elmwood & Claremont deserves a closer look than its 2.5% median suggests. Three of its 8 sales went 38% to 51% over asking, while the Claremont hill homes and two condos sold at or under list.
What Sellers Need to Know
- Oakland’s median days on market fell to 14, from 21 a year ago. In most of the neighborhoods shown, homes went into contract within about two weeks.
- Pricing strategy shapes the over-asking number. A Rockridge home listed low to draw offers and one listed near expected value can end at the same price with very different premiums, so the final sale price is the better number to compare.
- Condo-heavy areas moved differently. Around Lake Merritt, 47% of sales closed at or under list, so pricing close to recent sold comps carries more weight there than in the single-family neighborhoods.
- Berkeley closed 15 more sales in September than in August. More recent sales means more comps to price against.
Based on 283 residential sales that closed September 1 to 30, 2026, across Oakland (208), Berkeley (62) and Piedmont (13). Sourced from bridgeMLS, all property types, compared with August 2026 and September 2025. Inventory and months of supply are not included this month. All data deemed reliable but not guaranteed.
 Follow on Instagram